Last week we released the latest 2010.00.04 version of AutoChart. The major changes in this release are concerned with modifications to the Events functionality so that it is now possible to use Block Symbols within the events strips and to allow the creation of multi-panel PipeSheet events charts along a Route. In today's Blog post, I’ll start by covering the use of Block Symbols in Events panels.
Previous versions of AutoChart restricted the display of Point events to a simple tic and text marker. The latest version now allows the user to define and use Block symbols for particular Event Codes and also to use ‘Arrow’ Blocks to place arrowheads at each end of Line Events. The control of these options is set up by manually editing the Event Box ini file in a Text Editor.
The Blocks are defined in two parts - a Blocks section containing Block Codes which hold the path to the block drawing file and the required Block Scale. The Event Codes definition record then adds the required Block Code for the particular Primary/Secondary Event Code as well as the Block Insert Percentage:
A Block Code of ARROW (note this is Case Sensitive and must be all in Capitals) can be defined in the Blocks Section and then this used to place automatically oriented arrow heads on the ends of Line Events by using the 'Y' option at the end of the Line Event definition. If Arrows are not required then the option should be set to 'N'. Note that the Arrow Head Symbol drawing should be created with the point of the arrow at x=0, y=0 and pointing left - AutoChart will automatically flip the arrow when it is placed at the right side of the line event.
Note that in the example below, Point and Line definitions have been abbreviated to only show the relevant information. See the AutoChart Help File for an unabridged example.
TEXTSTYLES
#Name,Font,Height,Width
WMF-ARIAL1,arial.ttf,0,1
LINETYPES
#Name,File
LAYERS
#LayerName,Linetype,Colour
ANODE,Continuous,Red
FJ,Continuous,White
STRIPCOUNT
#StripCount
1
STRIPWIDTH
#StripNumber(must be in order for the moment),StripWidth
EVENTFORMAT
#EventFormat
ASA_Training_Events
BLOCKS
#BlockFormat
#Block Code,Block Path,Block Scale
AN-AD,C:\AutoChart\Symbols\Pipesheet Symbols\Anode Damaged.dwg,250
AN-AF,C:\AutoChart\Symbols\Pipesheet Symbols\Anode Retrofit.dwg,250
AN-AR,C:\AutoChart\Symbols\Pipesheet Symbols\Anode Remote.dwg,250
FJ-OK,C:\AutoChart\Symbols\Pipesheet Symbols \Field Joint.dwg,250
ARROW,C:\AutoChart\Symbols\Pipesheet Symbols\Left Arrow.dwg,250
.
.
CODES
#Point,Strip,PrimaryCode,SecondaryCode,Layer,Color,Linetype,LineWidth,StartTic%,EndTic…
#Line/Video,Strip,PrimaryCodeStart,SecondaryCodeStart,PrimaryCodeEnd,SecondaryCodeEnd,…
Line,1,S-MTS,,S-MTE,,0,256,ByLayer,0,80,WMF-ARIAL1,{…},83,Top Centre,,,,,,,,,,,Y
Line,1,S-VID,,E-VID,,0,256,ByLayer,0,80,WMF-ARIAL1,{…},83,Top Centre,,,,,,,,,,,N
Point,1,AN-DAMAGED,,ANODE,256,ByLayer,0,50,50,{…},35,Middle Centre,,,,,,,,,,,AN-AD,50
Point,1,AN-RETROFIT,,ANODE,256,ByLayer,0,50,50,{…},35,Middle Centre,,,,,,,,,,,AN-AF,50
Point,1,AN-REMOTE,,ANODE,256,ByLayer,0,50,50,{…},35,Middle Centre,,,,,,,,,,,AN-AR,50
Point,1,FJ-OK,,FJ,256,ByLayer,0,50,50,{…},35,Middle Centre,,,,,,,,,,,FJ-OK,50
.
.
So, for instance, in the Blocks Section, a Block Code of ‘AN-AD’ is defined that points to a Block dwg path of C:\AutoChart\Symbols\Pipesheet Symbols\Anode Damaged.dwg and the Block Insert Scale for this Code is set to 250. In the Codes Section, the Point Event definition for a Primary Code of “AN-DAMAGED” calls the Block Code of AN-AD and inserts the Block Symbol at a strip percentage of 50% (i.e. the mid-point of the strip).
The ARROW Block code points to a block symbol of a Left facing arrowhead, again with a block insert scale of 250. In the Line Event definition for the Start and End of Mattresses, the 'Y' option at the end of the definition denotes that the ARROW symbol should be added to the left and right ends of the line. AutoChart will automatically flip the direction of the arrow for the right side of the line. By contrast the Start and End of Video Line event uses a 'N' option at the end of the definition so that arrowheads are not added to this line.
Note that if the Start Tic Percentage is set the same value as the End Tic Percentage, the Line for the point events will not be drawn - i.e. in the example above, only the Block symbol will be inserted with the required event annotation. Any annotation should be entered as event text rather than attributes within the block definition.
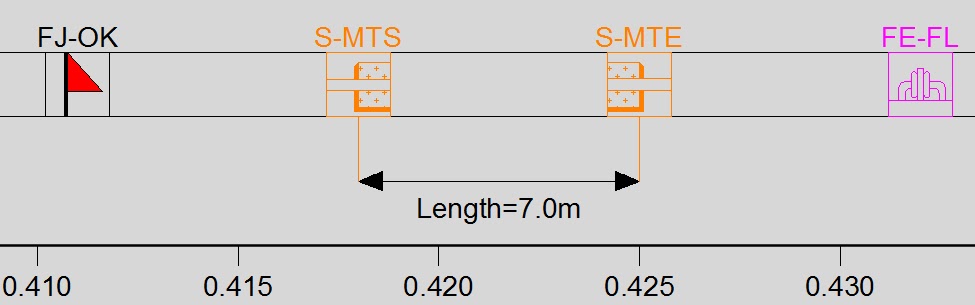
The Events will then be plotted with the appropriate Block Symbols to represent the relevant Event Codes as defined in the Event Box ini File:
No comments:
Post a Comment