6 December 2018

AutoChart Version 3.0.18340 is now available for download

We are pleased to announce that the latest AutoChart version 3.0.18340 (6th December 2018) is available for download from the Wish Software Support Page:
http://www.wishsoftware.com/AutoChartSupport.aspx

Access to the download page requires a User Name and Password, so please contact your company's AutoChart Administrator in the first instance to obtain the required login information.

The new version includes a number of new commands, updates, minor bug fixes and modifications and includes compatibility with the new BricsCAD v19 release.
The major changes are shown in the table below:
Type
ID
Description
Command
BG
1025
Style Features/Batch Style Features may not work correctly with MSD Data
Style Features
BG
1026
AutoCAD may crash if an AutoChart command is started without a dongle plugged in
AutoChart
BG
1028
Stringp nil error when creating an embedment profile from Eiva 5pt data
Create Profile
BG
1030
No Primary Profile Set when using Statoil C5P Format
Create Profile
BG
1031
KP Axis Xref may be incorrect if Interpolated Kps are used and the Profile does not start at zero
Xref Profile
BG
1032
KP Flags not at rounded interval position when Start Kp is not divisible by the required interval
Create KPs
FR
1033
Add Force Grid Start Depth (Lateral Offset) to Create Cross Profiles
Create Cross Profiles
FR
1034
Add option to use different panel horizontal scale for Cross Profiles panel
Create Cross Profiles - Current Drawing
FR
1035
Compatibility with BricsCAD V19
AutoChart
BG
1036
Issues with Profile Based Alignment Panels where the route has heavily scaled interpolated Kps
Create Panels - Classic
FR
1037
Remove seabed hatch boundary points around the vicinity of the pipe for CR2 format data
Create Cross Profiles
FR
1039
Update Export Kp Limits to work with MTEXT entities
Export Kp Limits
BG
1040
Alternate Cross Profile Colours not working if the Seabed Style is set to Line
Create Cross Profiles
BG
1041
When plotting CR2 format data as a Line, the processed flags are being included in the vertices
Create Cross Profiles
FR
1042
Ignore Header Line if present in Sitras OBS File format
Create Events
FR
1043
Read Clock Position Field from Sitras Obs File format and make it available in Event text
Create Events
FR
1044
Add command to run Overlay Cross Profiles in Current Drawing mode
Overlay Cross Profiles - Current Drawing

Please see the New Features Section of the AutoChart Help File for further details on the new commands and options.

If you require any further information about any of the changes, please contact Support@Wishsoftware.com.

16 October 2018

Surface Trench and Berm Design Tools in AutoChart for ArcGIS

In addition to importing survey data to GIS feature classes and automating the production of chart mxds, AutoChart for ArcGIS also includes some 3D design functionality to generate Trench and Berm features, either in a Plan sense or now by creating grade features on a longitudinal profile.

As ever there is a video you can watch that outlines the process:

Create Trench/Berm on Surface
The Create Trench and Create Berm commands will modify an existing Surface TIN feature to add trench or berm features based on the specified parameters.

A feature class containing the required line feature(s) to create the Trench/Berm along is then selected.
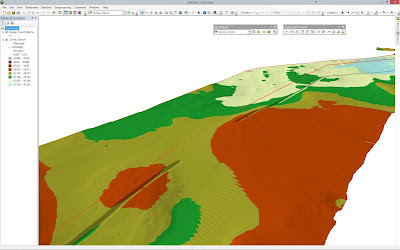
The TIN surface data is modified to create a new TIN containing the design features:
ArcScene can be used to view the surface in 3D:

Create Grade Profiles
A Longitudinal Profile Feature class at a suitable vertical exaggeration can be created directly from a Surface Feature and a Route line feature using the Create Profile command.

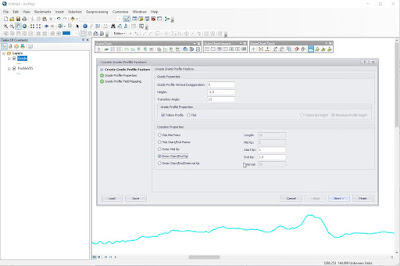
The Create Profile Feature command can then be used to generate Berm and Trench features along the profile based on specified design parameters.

Various creation methods can be used, either creating an individual grade feature for a fixed length at a selected position or entered Kp value, picking the start and end locations or entering their Kps, or creating multiple features at a defined interval between a specified Start and end Kp.

Enter the grade settings and choose the method of creation – below we are making Berms every 50m; Kp 0.650-0.800 with a flat top:
Which results in four berm features being added along the profile:
Here we are making a Trench from Kp 1.000 to Kp 1.500 following the profile above:
The Trench Grade feature is then created following the profile depths:
If required, the grade profile can be modified using standard ArcView tools such as Reshape Feature:

Grade Surface From Profiles
Next we apply those Grade Profiles to our Surface to add the new Trench and Berm features
Firstly choose which profile grade features to use:
 And then set the required parameters for the berm/trench features:
The command creates a new overall surface, a pre and post surface for each grade feature and set of polygons that detail the volumetric difference between each feature and the original surface.

The Polygon Feature Class showing the volumetric information of each feature in the Attribute Table:
 The modified Surface TIN with the new features added:
 Viewing the modified Surface TIN in ArcScene:
 A separate Surface TIN is created for each new feature

If you have any questions about this functionality please get in touch with us at Support@Wishsoftware.com

13 September 2018

VisualGIS Server

Wish Software is proud to announce a new version of VisualGIS Server with some exciting new features.

For now, it may be best for this blog entry to be “What is VisualGIS Server” as some of you may not be familiar with it.

VisualGIS Server is a web application that allows user to view subsea Digital Video with accompanying survey data in an HTML5 browser. It requires no install or browser add-ins.
VisualGIS Server optionally links to ArcGIS Server or ArcGIS Online for 2D GIS data and Autodesk Forge for 3D Data.
It can be utilised at the survey contractor level to provide access to clients to their data and/or at the Operator level for their own internal users as well as 3rd parties carrying out, for instance, environmental impact studies.

VisualGIS Server allows
New insights to be revealed by bringing disparate datasets together
Reduces time to identify issues
Year-on-Year comparators to asses temporal change
Viewing of Subsea Digital Video, Drone Video & High resolution Stills

The benefits of a web application are
No Shipping of drives
No Corporate IT requirement to install an application
Access to vast video data stores
Controlled access to 3rd party users over the Internet

For example, Equinor (Statoil) shares over 400TB of Digital Video to their users worldwide. Shell Norway have implemented VisualGIS Server in the Microsoft Azure Cloud Environment to allow 3rd party remote access. Nordstream 2 allows their users access to thousands of recent UXO surveys and timely ongoing updates during mattress installation & pipelay.

VisualGIS Server in action


The user can load video/survey datasets. Playing the video will cause all other windows to synchronise. Any action in any windows will cause all other windows to synchronise to the current position.
Note the Esri window on the middle-right – it is showing an ArcGIS Server service – again synchronised with all other windows.

A second window can be started that shows a survey of the same location at a different time – those 2 surveys are then synchronised on position.

VisualGIS Server can also be linked to Autodesk’s 3D Forge service that shows 3D objects and surfaces – in this case an Inline T-Assembly.

Future blog entries will describe drone footage; high-resolution stills and how we transcode older formats on-the-fly; no waiting around whilst the video is prepared!

Please get in touch with us at Support@Wishsoftware.com if you would like more information. If you would like to try it out for yourself then we can just provide a link!


15 August 2018

Using Esri MSD Data with AutoChart

In recent posts, we've shown how AutoChart can import features directly from a File Geodatabase feature class and add the GIS Attribute table as MAP Object Data to allow symbolisation of the entities in AutoCAD based on Object Data expressions.
The MAP Object Data functionality relies on the user running AutoCAD MAP or Civil 3D, so what options are there if you are using vanilla AutoCAD or BricsCAD?

The answer lies with ESRI Mapping Specification for Drawing (MSD) Data. This is a new specification created by ESRI which provides a method of defining and creating GIS content within CAD files.
When using AutoChart's GIS Attach/Import commands the user has the option of adding GIS attribute information either as MAP Object Data (in AutoCAD MAP or Civil 3D) or as ESRI MSD Data (in all versions of CAD).

Both Object Data and MSD Data operate in the same way when setting up the attribute mapping table, the required fields and their associated source values can be set up as required and the relevant information will be added to each entity.

Whereas MAP Object Data values on specific entities can be viewed directly in the AutoCAD Properties Palette, unfortunately this isn't the case with MSD Data. Instead you can use the AutoChart Show MSD Data command to view and edit the associated MSD values:

The AutoChart Style Features, Batch Style Features and Select Features commands can be used with both MAP Object Data and ESRI MSD Data.

One advantage that MSD Data has over MAP Object Data is that rather than having to export the CAD entities to an ESRI shp file with the associated object data values, a Dwg containing entities with attached MSD Data can be accessed directly as features in ArcView with the associated Attribute Table information.


The link below will open a video showing the process of using ESRI MSD data in AutoChart and accessing that data in ArcView.


If you have any questions about this functionality please get in touch with us at Support@Wishsoftware.com


10 August 2018

AutoChart Style Features and Batch Style Features commands

Following on from the recent release of AutoChart version 3.0.18215 and the previous post on Importing data from a File Geodatabase Feature Class, this next post will cover another new addition to AutoChart, the Style Features and Batch Style Features commands.
These commands allow entities that match an expression query of Object Data/Esri MSD field values to have their symbology changed to match a style expression - this may be changing the Colour/Layer/Linetype/Lineweight of the selected entities, changing hatch patterns for hatch entities or changing point entities to specified Block Symbols.

Style Features and Batch Style Features (along with the associated Select Features) commands can be found under the AutoChart - GIS Menu.


Style Features uses an expression based on Object data values to select which entities will be changed. The command will display a list of all Object Data Tables and their associated fields within the current drawing. Highlighting a field within the Table/Field list will allow Get Field Values to be used to show all of the unique values within that field. Alternatively, for numerical field values the Maximum/Minimum values can be displayed. An expression based on the required field values can then be created. The expression used for the selection can be saved to an external file using the Save Button and the Load button will set the expression from a previously saved definition.
Style Properties can then be applied to entities matching the specified selection expression.

The user can select which of the AutoCAD properties (Colour/Layer/Linetype/Lineweight) to adjust and set the required corresponding values. 

For Hatch entities a Hatch Style can be applied and for Point entities it is possible to convert each point object to a specified Block Symbol.
When the Block option is selected, the resultant dialog allows the user to select the required Block dwg or block definition within the current drawing to use instead of the matching point entities.

If the selected Block contains Attribute definitions, the user can then set the required field value expression to use for each attribute by clicking on the Edit option in the Attribute list:

A Batch version of the command can be used to apply multiple symbology changes over different selection criteria. The Batch Style Features command presents a list of Style Features definitions that can be run individually or all at once.

Style Features definitions can be created, edited or removed from the batch dialog with Add/Edit displaying the Style Features Dialog as above. Each Style Features definition can then be added to the Batch list and the order of individual operations set as required.
Both Style Features and Batch Style Features definitions can be saved to an external file for later re-use and existing definitions can be loaded to populate the batch list.

The link below will open a video showing the Batch Style Features process in action:


If you have any questions about this new functionality please get in touch with us at Support@Wishsoftware.com

9 August 2018

Using AutoChart to Import into CAD from a File Geodatabase

Last week saw the release of AutoChart version 3.0.18215 which includes a couple of major enhancements to allow the import of File Geodatabase Feature classes as CAD entities and to use MAP Object Table or ESRI MSD Table attributes to style and symbolise imported data.

In the first of two blog posts I'll demonstrate the Import File Geodatabase command before covering the Style Features command in a second post.

Import File Geodatabase can be found under the AutoChart-GIS Attach/Import menu:
The command allows Point, Line or Polygon Feature classes to be imported to create corresponding entities in CAD. Optionally values within a specified field can be used to provide the Layer names for associated entities and the colours of those layers can be cycled through a fixed palette.

The Feature Class Attribute Table can be added to each entity using an AutoCAD MAP Object Table (AutoCAD MAP/Civil 3D only) or as an ESRI MSD Table.
The fields and associated values within that table can then be defined as required in the Mapping Table setup.
Each Feature within the selected Feature Class will be imported into the current drawing as a corresponding CAD entity - point entities if the source is a Point Feature Class, polylines if it is a line feature class or hatches for a polygon feature class.
The link below will open a video showing the process in action:


As always, if you have any questions about this new functionality please get in touch with us at Support@Wishsoftware.com


3 August 2018

AutoChart Version 3.0.18215 is now available for download

We are pleased to announce that the latest AutoChart version 3.0.18215 (3rd August 2018) is available for download from the Wish Software Support Page:
http://www.wishsoftware.com/AutoChartSupport.aspx

Access to the download page requires a User Name and Password, so please contact your company's AutoChart Administrator in the first instance to obtain the required login information.

The new version includes a number of new commands, updates, minor bug fixes and modifications. The major changes are shown in the table below:
Type
ID
Description
Command
FR
1011
Update Sitras obs Event format to match Statoil Ver. 7 defintion
Add Events to Plan
FR
1012
Add option to insert Route heading symbols between polyline vertices of selected route
Label Route Vertices
FR
1013
New Commands. Style Features and Batch Style Features to change AutoCAD properties based on Object Data expression
Style Features/Batch Style Features
FR
1014
New Command. Select Features creates a selection set based on specified expression
Select Features
FR
1015
Include Kp values in exported SBP data when the Calculate Easting/Northing option is used
Export SBP Data
BG
1016
Xref/Block Remove crashes in AutoCAD 2019
Xref/Block Remove
BG
1017
Kp Offset when adding Paired Events to Profile with Interpolated Route Kps
Add Paired Events to Profile
BG
1021
Center Panels in Panel Area not working in 3rd Plan Panel
Create Charts
FR
1022
Add option to display Slope Block values as percentages
Add Slope Block
FR
1023
New Command. Import File Geodatabase to create cad line or point entities directly from a feature class held in a file geodatabase
Import File Geodatabase
BG
1024
Potential for incorrect Geodetic Kp Flag placement on routes with vertices at a very small interval
Create Kps

Please see the New Features Section of the AutoChart Help File for further details on the new commands and options.

If you require any further information about any of the changes, please contact Support@Wishsoftware.com.