21 October 2010

Using AutoChart to make Pipesheets

The 2010.00.04 version of AutoChart introduced a new Create Pipesheets command that can be used to make a single or multiple 'Events only' pipesheet chart along an entire route or over a specified Kp range.

The command uses a Base template drawing to provide the chart background and allows up to six events panels on each chart. the format of the displayed data within these events panels is controlled by an Event Box ini file in the normal Create Events manner, with the data being read from an events ASCII file.

The events data format would normally be set up in a Custom Format ini file although the usual built in AutoChart formats can also be used. Data can be from a single file, a directory of files or from VisualWorks Events.csv files held in a VisualWorks Report Directory Structure.

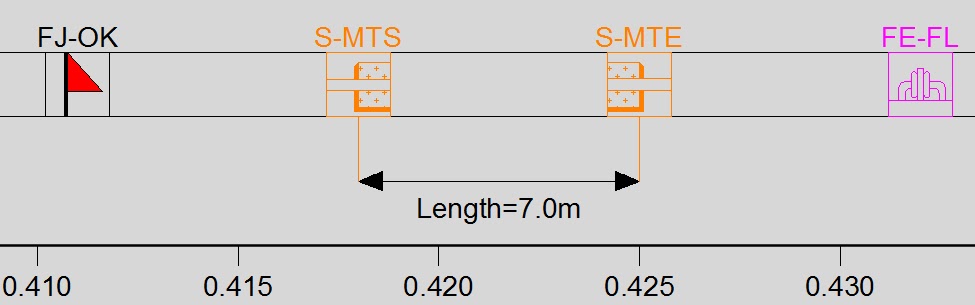
The Event ini file is created in the same manner as for the normal Create Events Panel command with Line and Point Events for all of the Primary/Secondary codes that are required to be shown on the pipesheet. As detailed in an earlier blog post, Block Symbols can be used to represent event codes if required.

The drawing file containing the required Route entity should be selected and the appropriate Route ID chosen if this drawing contains multiple routes. This enables event KPs to be recalculated against the Route entity if required and also allows the Chart Kp limits to be annotated.

The Template drawing should be drawn in the same manner as the normal AutoChart Create Charts Template (i.e. in 'real-world' units at the appropriate scale). The template can contain the usual AutoChart codes for Kp limits, chart number, etc. and these will be automatically calculated and filled in when the Charts are created. There is no option to specify a separate Base Drawing. Instead this should already be xreffed (by the User) into the Template drawing before running the Create Pipesheets command. The Base Xref should contain all of the entities that will remain the same for every chart in the series (i.e. the Chart frames/Titles/Legend etc.) whereas the Template drawing itself should contain the entities that will alter from chart to chart (i.e. the Chart number/reference, the Kp Limits, etc.). The Chart Directory is set to the required folder location for the pipesheet drawing files to be created.

Panels are automatically created along the entire route or optionally over a specified Kp range. The Panel Length and Height should be entered in drawing units and the required overlap between panels can also be set (or enter 0 to have no panel overlap). A First Panel offset can be entered to allow an initial overlap within the first pipesheet panel.

The Kp Axis should be set up with the Line/Major Tic/Minor Tic/Text intervals as required along with the Kp calculation method. If the Pipesheet template contains the codes SSS.SSS and EEE.EEE then the Kp limits for each chart can automatically be calculated and filled in and the required format of the Kp annotation can be selected.

The required number of Events panels within each chart should be selected (up to six panels can be added) and the Bottom Left Hand Corner coordinates for each of these panels should be picked.
When run, the command will automatically create all of the pipesheets for the length of the Route (or for the specified Start and/or End Kp/MP values) and add the Events data to each panel.
If you have any questions or require any further information about using this command, then please contact Wish Software Support.

19 October 2010

AutoChart version 2010.00.05 is now available for download

We are pleased to announce that the latest AutoChart version 2010.00.05 is available for download from the Wish Software Support Page:

Access to the download page requires a User Name and Password, so please contact your company's AutoChart Administrator in the first instance to obtain the required login information.

Version 2010.00.05 contains a couple of bug fixes, including fixing a problem in the 2010.00.04 version that would cause the Create Profile command to crash.

The list of changes is detailed in the table below:
Type
ID
Description
Command
BG
697
Create Profile Crashes with a numberp nil error
Create Profile
BG
698
Create Pipesheets ignores the 1st Pipesheet Number setting from the Dialog
Create Pipesheets
FR
701
Added "BRSO" variable to use (Sears) Foot coordinate system (Borneo) with Km Route distances
AutoChart
If you have already downloaded and installed the 2010.00.04 version of AutoChart, please update to the 2010.00.05 installation.

11 October 2010

Using Block Symbols in the Events Panel

Last week we released the latest 2010.00.04 version of AutoChart. The major changes in this release are concerned with modifications to the Events functionality so that it is now possible to use Block Symbols within the events strips and to allow the creation of multi-panel PipeSheet events charts along a Route. In today's Blog post, I’ll start by covering the use of Block Symbols in Events panels.

Previous versions of AutoChart restricted the display of Point events to a simple tic and text marker. The latest version now allows the user to define and use Block symbols for particular Event Codes and also to use ‘Arrow’ Blocks to place arrowheads at each end of Line Events. The control of these options is set up by manually editing the Event Box ini file in a Text Editor.

The Blocks are defined in two parts - a Blocks section containing Block Codes which hold the path to the block drawing file and the required Block Scale. The Event Codes definition record then adds the required Block Code for the particular Primary/Secondary Event Code as well as the Block Insert Percentage:

A Block Code of ARROW (note this is Case Sensitive and must be all in Capitals) can be defined in the Blocks Section and then this used to place automatically oriented arrow heads on the ends of Line Events by using the 'Y' option at the end of the Line Event definition. If Arrows are not required then the option should be set to 'N'. Note that the Arrow Head Symbol drawing should be created with the point of the arrow at x=0, y=0 and pointing left - AutoChart will automatically flip the arrow when it is placed at the right side of the line event.

Note that in the example below, Point and Line definitions have been abbreviated to only show the relevant information. See the AutoChart Help File for an unabridged example.

TEXTSTYLES
#Name,Font,Height,Width
WMF-ARIAL1,arial.ttf,0,1

LINETYPES
#Name,File

LAYERS
#LayerName,Linetype,Colour
ANODE,Continuous,Red
FJ,Continuous,White

STRIPCOUNT
#StripCount
1

STRIPWIDTH
#StripNumber(must be in order for the moment),StripWidth

EVENTFORMAT
#EventFormat
ASA_Training_Events


BLOCKS
#BlockFormat
#Block Code,Block Path,Block Scale
AN-AD,C:\AutoChart\Symbols\Pipesheet Symbols\Anode Damaged.dwg,250
AN-AF,C:\AutoChart\Symbols\Pipesheet Symbols\Anode Retrofit.dwg,250
AN-AR,C:\AutoChart\Symbols\Pipesheet Symbols\Anode Remote.dwg,250
FJ-OK,C:\AutoChart\Symbols\Pipesheet Symbols \Field Joint.dwg,250
ARROW,C:\AutoChart\Symbols\Pipesheet Symbols\Left Arrow.dwg,250
.
.

CODES
#Point,Strip,PrimaryCode,SecondaryCode,Layer,Color,Linetype,LineWidth,StartTic%,EndTic…
#Line/Video,Strip,PrimaryCodeStart,SecondaryCodeStart,PrimaryCodeEnd,SecondaryCodeEnd,…
Line,1,S-MTS,,S-MTE,,0,256,ByLayer,0,80,WMF-ARIAL1,{…},83,Top Centre,,,,,,,,,,,Y
Line,1,S-VID,,E-VID,,0,256,ByLayer,0,80,WMF-ARIAL1,{…},83,Top Centre,,,,,,,,,,,N
Point,1,AN-DAMAGED,,ANODE,256,ByLayer,0,50,50,{…},35,Middle Centre,,,,,,,,,,,AN-AD,50
Point,1,AN-RETROFIT,,ANODE,256,ByLayer,0,50,50,{…},35,Middle Centre,,,,,,,,,,,AN-AF,50
Point,1,AN-REMOTE,,ANODE,256,ByLayer,0,50,50,{…},35,Middle Centre,,,,,,,,,,,AN-AR,50
Point,1,FJ-OK,,FJ,256,ByLayer,0,50,50,{…},35,Middle Centre,,,,,,,,,,,FJ-OK,50
.
.

So, for instance, in the Blocks Section, a Block Code of ‘AN-AD’ is defined that points to a Block dwg path of C:\AutoChart\Symbols\Pipesheet Symbols\Anode Damaged.dwg and the Block Insert Scale for this Code is set to 250. In the Codes Section, the Point Event definition for a Primary Code of “AN-DAMAGED” calls the Block Code of AN-AD and inserts the Block Symbol at a strip percentage of 50% (i.e. the mid-point of the strip).
The ARROW Block code points to a block symbol of a Left facing arrowhead, again with a block insert scale of 250. In the Line Event definition for the Start and End of Mattresses, the 'Y' option at the end of the definition denotes that the ARROW symbol should be added to the left and right ends of the line. AutoChart will automatically flip the direction of the arrow for the right side of the line. By contrast the Start and End of Video Line event uses a 'N' option at the end of the definition so that arrowheads are not added to this line.

Note that if the Start Tic Percentage is set the same value as the End Tic Percentage, the Line for the point events will not be drawn - i.e. in the example above, only the Block symbol will be inserted with the required event annotation. Any annotation should be entered as event text rather than attributes within the block definition.

The Events will then be plotted with the appropriate Block Symbols to represent the relevant Event Codes as defined in the Event Box ini File:

7 October 2010

AutoChart version 2010.00.04 is now available for download

We are pleased to announce that the latest AutoChart version 2010.00.04 is now available for download from the Wish Software Support Page:
http://www.wishsoftware.com/AutoChartSupport.aspx

Access to the download page requires a User Name and Password, so please contact your company's AutoChart Administrator in the first instance to obtain the required login information.

Version 2010.00.04 contains a number of modifications and bug fixes, the details of which are shown below:
Type
ID
Description
Command
FR
683
Add Option for 'Open Cross' type Graticule/Grid
Create Grids
BG
684
Create Panels - Multiple Routes crashes when used with Profile Based alignment Panels and long routes
Create Panels Multiple Routes
FR
685
Added ability to use software licensing for Lease/Temporary licenses
AutoChart
BG
686
Profiles polylines created from LPA files are not classified as 'Primary' so SBP data cannot be added
Create Profile
BG
687
Add SBP crashes with a consp nil error when a chart contains multiple Profile Panels
Add SBP Data
BG
689
Import Route using multiple files in a Directory does not draw any route polylines for certain formats
Import Route
FR
690
Add option to always show the first and last fix symbol and/or label regardless of interval used
Import Track
FR
691
Allow 'Name' Field to be used in Custom Track Formats
Import Track
FR
692
Allow 'Latitude' and 'Longitude' fields to be used as valid position data in Custom Formats
AutoChart
BG
693
Move Profile Xref crashes with a numberp nil error
Move Profile Xref
BG
694
Geoconsult SBP formats missing from Add SBP Data command
Add SBP Data
FR
695
Add functionality to insert Block symbols at Point Events and/or arrows on Line Events
Create Events
FR
696
New Command. Create PipeSheets
AutoChart
As usual, I'll be discussing some of the changes in a forthcoming post on this blog.