7 February 2012

Making Blocks, Text and Hatches match the Panel orientation in Paper Space Charts

In my previous Blog post (some time ago) I discussed the new Paper Space Charting capabilities of AutoChart and mentioned the use of Annotative Blocks and Text within xreffed data rather than having to use Cut data to rotate objects to read horizontally within the chart plan panels.
Note that the use of annotative Text, Blocks and Hatches with the 'Match Orientation to Layout' option enabled in an Xref Drawing could be used instead of the normal Cut Data and Insert/Xref Cut Data procedure to provide 'horizontally reading' entities within the charts.
However, what I omitted was how to actually set up Blocks and Text to have the 'Match Orientation to Layout' property enabled, so today I'll address this omission by covering the processes involved.
With Text entities, the easiest option to have the text match its orientation to the layout is to create a new text style and turn on the Annotative and Match text orientation to layout options for that style:
It's then simply a matter of using this annotative text style for any text entities you want to have rotated to read horizontally within each Plan panel.
Alternatively, you can set the Annotative and Match Orientation to Layout options in the Properties pallette for selected text entities that don't use an annotative text style:

When the Data drawing is Xreffed into the Charts, the text will display North-up (i.e. horizontally) in the model view, but will also display horizontally within each Chart Plan panel viewport no matter the angle of the panel. For any Text you don’t want to be shown rotated (i.e. keep the original rotation from the Model Space), then just make sure it uses a non-annotative text Style and its annotative property is disabled.

Blocks are a little more tricky to sort out – although there is an AutoCAD drawing variable (ANNOTATIVEDWG) that you can set to make a dwg annotative when it is inserted as a block, currently there is no way to set the ‘Match Orientation to layout’ option for that annotative block.
For that reason, the easiest method is to insert the Block symbols as normal, e.g. using Import Block Data, with a 'North-up' orientation. Once the blocks have been created for the various targets, type BLOCK at the AutoCAD command line to start the Block Definition dialog. Choose the appropriate Block Name from the drop down list and then change the Behaviour settings to turn on Annotative and then turn on Match block orientation to layout:
Click OK and then AutoCAD will prompt you to redefine the Block:
Select the Redefine block option and then all targets using that block symbol will be made annotative. Repeat the operation for all other block symbols in the data drawing that you want to rotate to read horizontally within each Chart Plan Panel. For any Blocks that you wan to retain their model space orientation (i.e. those that represent and actual real-world direction), just make sure that they are not annotative.

To make a Hatch entity match its orientation to the layout, you simply need to create the hatch pattern as Annotative. An annotative hatch will always be rotated to maintain its orientation within the layout viewport so there's no 'Match Orientation to Layout' option.
Alternatively, you can turn on the annotative property of an existing hatch by setting it in the properties palette for selected hatch entities.

By Making Text and Blocks (and Hatches if required) annotative, you don’t have to use the AutoChart Cut Data command to rotate the entities when they are added to the charts. Instead, you just use the Xref Data command to add the entire data drawing to the charts.

The Xref is added to the model Space of the chart drawings so that it can be seen through the Viewports on the Chart Layout Tabs. A Viewport freeze is applied to the Panels you don’t want the data displayed in, so for example, in the above situation, the Geo Interpretation data Xref is hidden in the Top Plan boxes by VP freezing the Layer in those viewports.

23 November 2011

New Features in AutoChart 2010.00.09

AutoChart Version 2010.00.09 was released at the beginning of November. Unfortunately, due to other commitments, I've not been able to write a blog post about some of the major changes until now. But, with the adage of "Better Late than Never", here's a quick roundup of the two major changes introduced in this version.
  • Paper Space Charts option
  • Use of Paper units and Plot Scale for Text Heights/Tic Lengths/Line widths, etc.

Firstly, AutoChart has been modified so that it can now create and fully work with 'Paper Space' charts - i.e. the Model Tab just contains the real-world plan data (as Entities, Blocks or Xrefs) and each Chart Drawing (with Profile/Cross Profile/Events panels) is created on a Layout Tab. The option to continue working in the usual AutoChart manner with Charts created in the Model space still remains and for most operations, the procedures involved are identical whether you are working with model space charts or paper space charts - the only real difference comes in the Create Charts dialog and consequently how the Chart Base and Template drawings are set up.

Secondly, as part of this change to allow Paper Space charts within AutoChart, the entries for Text Heights/Tic Lengths etc. in the various dialogs have been changed so that the User should enter the required Height/Length at the appropriate printed size rather than in 'real' units at the required scale as per the previous AutoChart procedure. A plot scale (either entered in the 'Current Drawing' dialog or saved to the Charts as part of the Create Charts command) is then used to scale these 'Paper height' values to the correct 'real-world' size for the specified chart scale.

4 November 2011

AutoChart version 2010.00.09 is now available for download

We are pleased to announce that the latest AutoChart version 2010.00.09 is available for download from the Wish Software Support Page:

http://www.wishsoftware.com/AutoChartSupport.aspx

Access to the download page requires a User Name and Password, so please contact your company's AutoChart Administrator in the first instance to obtain the required login information.

Version 2010.00.09 contains a number of modifications, new commands and bug fixes with the major changes being the new option to create and work with Paper Space charts (rather than the traditional AutoChart method of creating a single Model Space drawing for each chart) and a move to plotted paper units for all Text Heights, Tic Lengths etc. making it easier to re-use a project acp file for different scale charts. Please be sure to see the New Features section of the Help File for a full explanation of the changes.

Full Details of the changes in the latest AutoChart version can be found in the table below:
Type
ID
Description
Command
FR
129
Line Width on Event Box to use a percentage rather than absolute value
Create Event Box ini
BG
630
Import Track crashes when using a E/N/Fix format file
Import Track
BG
735
Enable Charts - Chart Series incorrectly reports "Chart Enabled maximum of 0 reached"
Enable Charts
BG
736
Depth Axes placed on wrong side of (split) box when Xref Profile used on descending Kp Charts
Xref Profile
BG
737
Draw Average Velocity Trendline command does not run from the menu
Draw Average Velocity Trendline
FR
738
Changes to Label Point and Label Route Points commands
Label Point
BG
739
Create Route Coordinate table crashes with Kingfisher Data
Create Route Coordinate Table
BG
740
Cannot add a "+" sign as Event text in the Create Event Box ini Dialog
Create Event Box ini
FR
741
New Command Create MPolygons
Create MPolygons
FR
743
Speed up operation of Add SBP Data command
Add SBP Data
FR
744
Add ability to create multiple sets of Profile/XProfile/Events Blocks/Xrefs for different data/settings
AutoChart
FR
746
Add Object Data to Track Fix Symbols
Import Track
BG
747
Possible incorrect Kp calculation where route polyline contains very short arc segments
Create Profile
FR
748
Allow separate vertical and lateral scales in Create Cross Profiles
Create Cross Profiles
FR
749
Add ability to create and work with Paper Space Charts
AutoChart
FR
750
Add TLGH Coda Track and Coda Track Fix Formats
Import Track
FR
751
Allow Point on Line records to be included as rows in Engineering Table
Create Route Coordinate Table
BG
753
Create Profile tags all Profile polylines as 'Secondary' when Profile is split due to Depth
Create Profile
FR
754
Add ability to overlay further cross profile info (e.g. Top of Pipe) to existing plotted cross profiles
Overlay Cross Profiles
BG
755
Profile polylines are created with linetype generation disabled when PLINETYPE variable set to 0
Create Profile
BG
756
Profile Panel not positioned correctly with split Profile Based alignment sub-panels
Create Profile
FR
757
Add Subsea7 Route Table Format
Create Route Coordinate Table
FR
758
Change text height settings to use Paper units and Plot Scale rather than real (scaled) units
AutoChart
FR
760
New Command - Add Kp Data to Block
Add Kp Data to Block
FR
765
Add Surfer BLN format to Add SBP Data to draw Sub-bottom areas rather than horizons
Add SBP Data
As always, I'll be discussing some of the recent changes, including the options for Paper Space charts, in a forthcoming post on this blog or please contact us if you require any further information on any of the new features.

19 August 2011

Coordinate Systems in AutoCAD MAP 2012

AutoCAD MAP 2012 sees a major change from previous versions in the way Coordinate Systems are defined. In terms of AutoChart, these changes have no effect in working with pre-existing definitions, you still choose the Projection CS and the Geographic CS in the same way as always, however, if you need to define a new coordinate system in MAP, the process can now seem quite unfamiliar.

In this Blog post, I hope to give a brief overview of what’s involved in working with the new Coordinate Systems dialogs to create a UTM Zone 47N Projection based on the ‘Batavia’ datum.
Spheroid Bessel 1841
Datum Batavia
Semi-major axis (a) 6 377 397.155 m
Semi-minor axis (b) 6 356 078.963 m
Inverse flattening (1/f) 299.1528128
Projection Parameters
Projection Universal Transverse Mercator (UTM)
Zone 47 North
Latitude of Origin 00° 00’ 00” N (Equator)
Central Meridian 99° 00’ 00” E
Scale Factor at Origin 0.9996
False Easting at Origin 500 000m
False Northing at Origin 0 m
Unit of Measurement International Metres
Datum Transformation From WGS84 to Local Datum
DX plus (+) 377.00 m
DY minus (-) 681.00m
DZ plus (+) 50.00m
Example Transformation
WGS-84 Batavia
Lat : 5° 17’ 58.94133” N Lat : 5° 18’ 02.34112” N
Long : 97° 19’ 46.85008” E Long : 97° 19’ 37.52676” E
Easting : 314 898.576 m Easting : 314 633.300 m
Northing : 586 042.752 m Northing : 586 091.720 m

When faced with working with an unfamiliar coordinate system, we have to start by confirming whether the coordinate system already exists within the AutoCAD MAP definitions.

The easiest way to do this is to start the command called Library (MapCSLibrary)


Now type in the name of the Datum in the search (e.g. “Batavia”) and see which Projections are available which use this datum name:


For a start we see there is no UTM 47N available but there is a datum (Batavia_1) and a datum transformation (Autodesk now calls these "geodetic transformations") (Batavia_1_to_WGS84) that may be useful. If we click on these and select view we can check the values of the datum and the transformation.
Datum:


Transformation (Analytical Formula Transformation Page)


This shows us that the Ellipsoid used within the Datum definition is correct and the transformation parameters match the requirements.

Now we have to make a coordinate system using this Datum. You can leave this command and start the Create Coordinate system command but actually it is probably easier to choose one of the existing UTM coordinate systems and use Duplicate.

Once the new coordinate system has now been created we must change the values, so use the Edit button in the form and change the Code, Description and values on each page to the correct values.


Once all of the various parameters have been set up, choose Save.

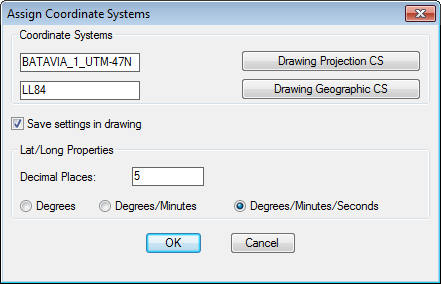
Now you just need to check the definition woks correctly by using the AutoChart commands.

Start the point command – type in the Batavia E/N. Change the point type and zoom extents.
Start the AutoChart|Inquiry|Point Id|Single command


Snap to the node of the point and the LL84 Lat/Longs will be displayed and can be checked against the supplied values.

If a suitable Datum definition doesn't already exist, a new Datum can be created in a similar way to creating a Projection. Once the Datum has been defined, a Geodetic Transformation can then be created to specify the Datum Shift parameters to or from WGS84.